
Visualization of the sociotechnical relationships of artificial intelligence and graphic design
DOI:
https://doi.org/10.56162/transdigital368Keywords:
bibliometric visualization, socio-technical relationships, artificial intelligence, graphic design, bibliographic reviewAbstract
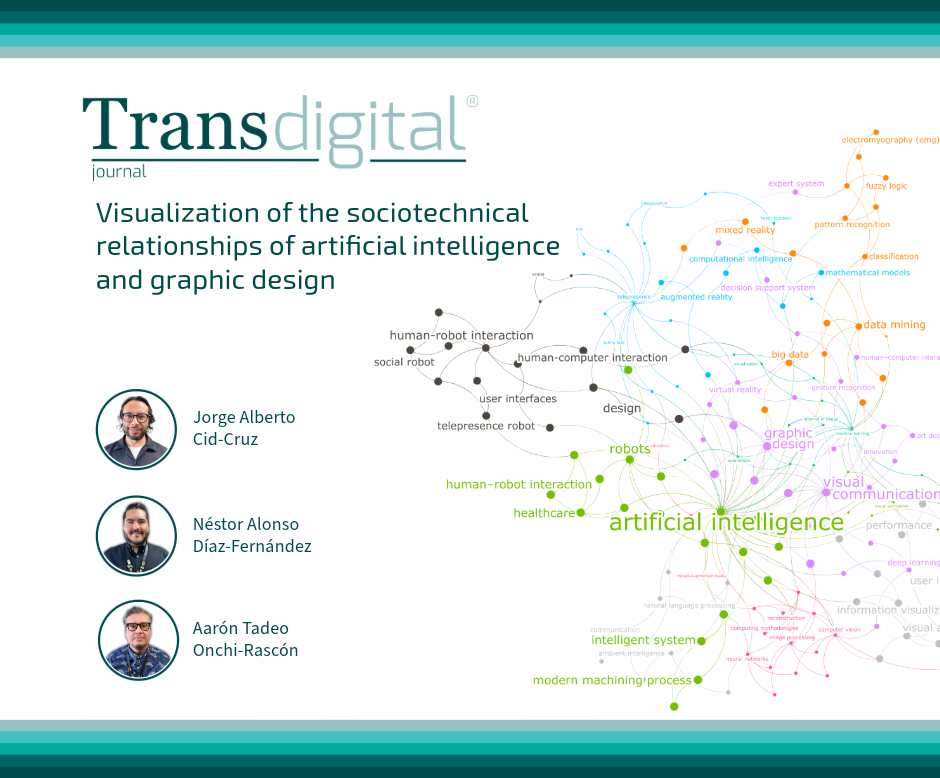
In the context of graphic design (GD), artificial intelligence (AI) is a disruptive technology that causes controversy and fascination. However, the joint work of AI with the GD has been in development for several decades. For this reason, based on several methods to interpret the bibliometric visualization and methodological elements, an analysis was carried out focused on different stages that the AI went through in relation to the GD. Likewise, the sociotechnical relationships that the AI and the GD built in recent years were identified. In this way, an ecosystem map was generated to understand the multiplicity of relationships and approaches of both disciplines to date. This evidenced a disciplinary synthesis stabilized through developing academic subareas and potential fields of application.
References
Arellano Hernández, A. (Coord.). (2011). Tramas de redes sociotécnicas: Conocimiento, técnica y sociedad en México (1a. ed). Miguel Ángel Porrúa.
Bastian, M., Heymann, S., & Jacomy, M. (2009). Gephi: An Open Source Software for Exploring and Manipulating Networks. Proceedings of the International AAAI Conference on Web and Social Media, 3(1), 361-362. https://doi.org/10.1609/icwsm.v3i1.13937
Beaubien, A. K., Hogan, S. A., & George, M. W. (1982). Learning the library: Concepts and methods for effective bibliographic instruction. Bowker.
Dondis, D. A. (2010). La sintaxis de la imagen: Introducción al alfabeto visual. The MIT Press.
Hansen, S. M. (2019). Mapping Creative Coding Courses: Toward Bespoke Programming Curricula in Graphic Design Education [Sesión de congreso]. The European Association for Computer Graphics 40th Annual Conference, Genoa, Italy.
Jacomy, M., Venturini, T., Heymann, S., & Bastian, M. (2014). ForceAtlas2, a Continuous Graph Layout Algorithm for Handy Network Visualization Designed for the Gephi Software. PLoS ONE, 9(6), e98679. https://doi.org/10.1371/journal.pone.0098679
Keresztesi, M. (1981). Bibliographic instructions in the 1980s and beyond. En C. Kirkendall (Ed.), Directions for the decade: Library Instructions in the 1980s. Pierian.
Labuz, R. (1993). The computer in graphic design: From technology to style. Van Nostrand Reinhold.
Latour, B. (2007). Reassembling the social: An introduction to Actor-Network-Theory. Oxford University Press.
Menges, A., & Ahlquist, S. (Eds.). (2011). Computational design thinking. Reader.
Mustafa, B. (2023). The Impact of Artificial Intelligence on the Graphic Design Industry. Arts and Design Studies, 104. https://doi.org/10.7176/ADS/104-01
National Center for Education Statistics. (2024). College Navigator. Página web oficial de Institute of Education Science. https://nces.ed.gov/collegenavigator/
Novelli, C., Casolari, F., Hacker, P., Spedicato, G., & Floridi, L. (2024). Generative AI in EU Law: Liability, Privacy, Intellectual Property, and Cybersecurity. SSRN Electronic Journal. https://doi.org/10.2139/ssrn.4694565
National Center for Education Statistics. (2024). Diagrama de Sankey. Página web oficial de National Center for Education Statistics. https://datavizcatalogue.com/ES/metodos/diagrama_de_sankey.html
Silver, D., & Massanari, A. (Eds.). (2006). Critical cyberculture studies. New York University Press.
Terzidis, K. (2009). Algorithmic architecture. Elsevier.
Downloads
Autor de correspondencia
El autor de correspodencia se identifica con el siguiente símbolo: *Published
How to Cite
License
Copyright (c) 2024 Jorge Alberto Cid-Cruz, Néstor Alonso Díaz-Fernández, Aarón Tadeo Onchi-Rascón

This work is licensed under a Creative Commons Attribution 4.0 International License.
All articles in Transdigital are licensed under a Creative Commons Attribution 4.0 International License. Authors hold the copyright and retain publishing rights without restrictions.


